Chapter 6 Evaluation From Players
In this part, we focus on the evaluation of games. There exist many standards to evaluate games. Here we use positive rates ratio, average playtime and sales as the standard of the games evaluation. And we also put the price of games into our analysis to see the price strategy of game companies.
For these three evaluation criteria, ratio is the most convincing one as it represents the impression of players. It directly shows the mainstream opinion toward the games. The average playtime not only depends on the quality of games, but also depends on the type of games. Sales will be influenced by the reputation of the companies and the advertisement of the games.
Price is a kind of evaluation, too. It shows the resources put in it and it represents the evaluation from the companies in some way.
6.1 Parallel Coordinates
After the brief look and filtering, we draw the parallel coordinates to see the relationship between different game factors. With the interactivity, we can find some intuitive trends:
Valve and Ubisoft have many free games, which corresponds to our claim above.
Majority of game with low price have a large ratio of good ratings
Almost all the games have large ratio, which accord with the claim that AAA games have large ratings
High ratios will also have relatively high average playtime
6.2 Correlation of Different Variable
We want to see the relationships among the variables of all AAA games. In the shiny app above, users would choose two variables from “Average playtime”, “Ratio”, “Sales Volume”, “Price” and “Sales” and get the dot plot of them.
From the plot, we find positive relationships between average playtime and sales volume, average playtime and sales.
Ratio does not affect much on average playtime or sales. For AAA developers, even though they release some bad-rating games, people still buy them. That is one of the most important privileges of AAA companies: they have super fans and they tolerate the games of not-good-enough quality.
Price does not affect much on sales volume. For AAA games, they would have normal sales with acceptable price.
6.3 Relationship of AAA and non-AAA
We will then compare the evaluation criteria between AAA and Non-AAA games.
6.3.1 Ratio and Price
As we said it before, ratio is the most objective standard. So we choose ratio as x-axis and the other factors as y-axis. We want to see the relationship between opinions of players and the other factors.
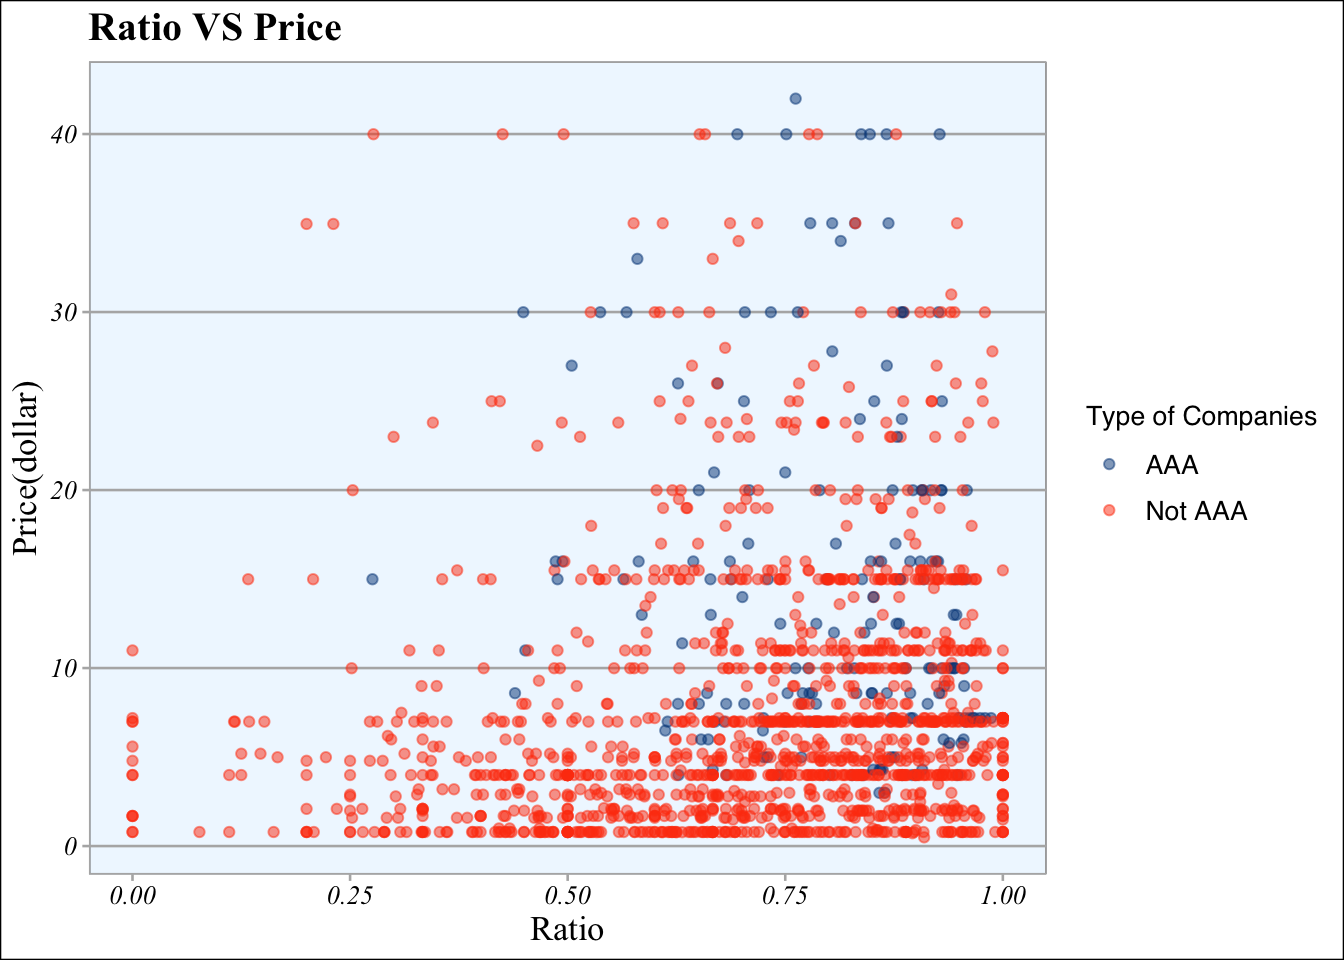
We draw a dot plot to see the difference between AAA companies and others. AAA companies have even price distribution in the whole range, while the others tend to have lower price. Moreover, almost all the games of AAA companies have ratio over 0.5, while others distribute evenly in the whole range.
A high price shows the confidence of its developer. We can see from that graph that Non-AAA companies are not willing to set a high price. It’s intuitive because high price will easily lead to a low sales volume. AAA companies have the confidence that high price won’t influence the sales while Non-AAA companies don’t want to take the risk. So Non-AAA companies tend to lower their price to attract more players.
And it’s interesting that there are very few games with high price and low ratio. We guess that means developers have a clear knowledge of how good their games are.
6.3.2 Ratio and Sales
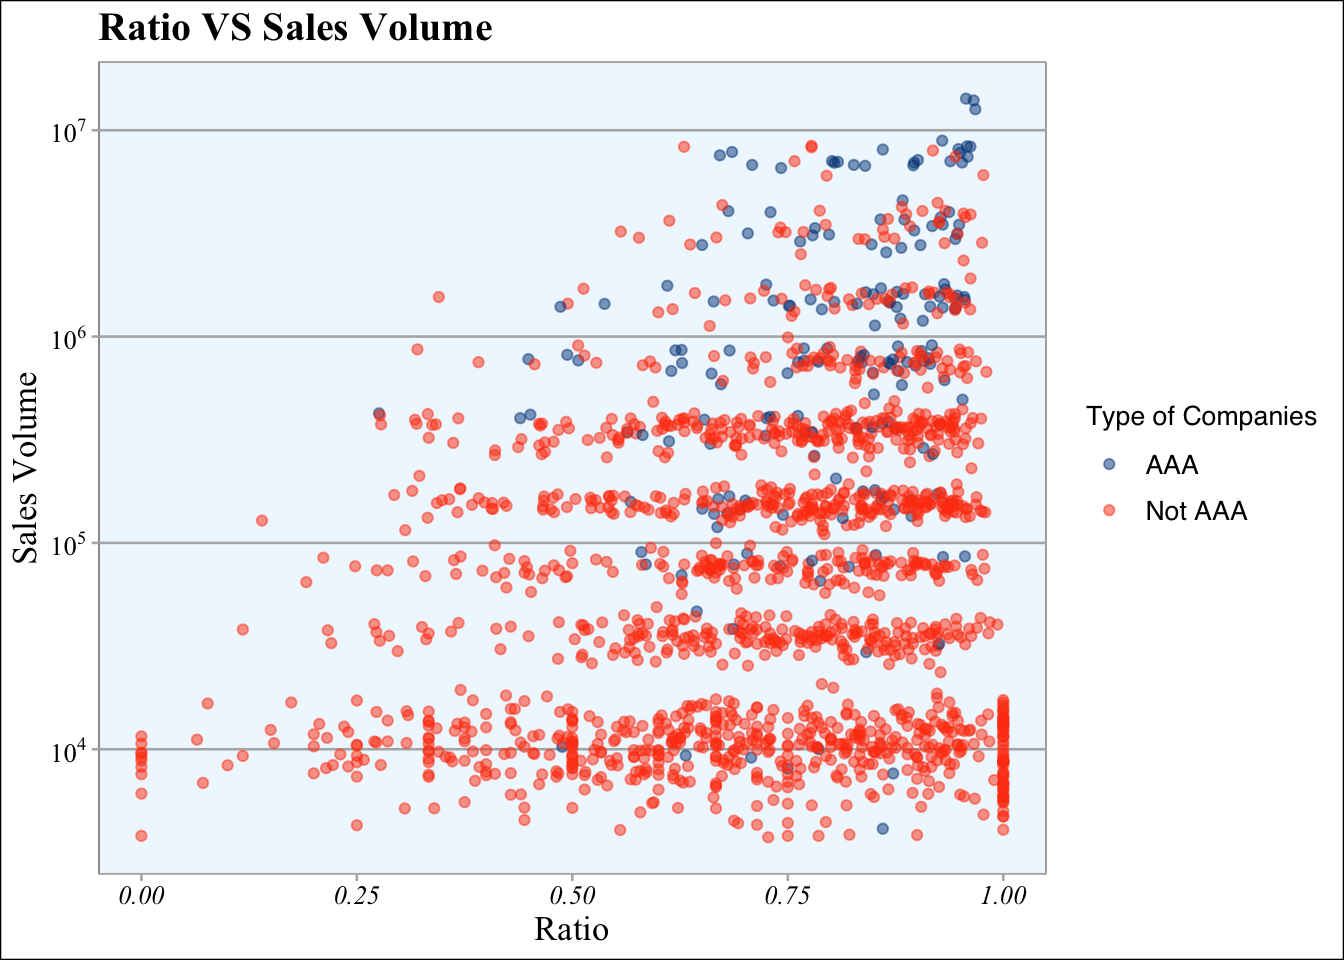
We do more analysis with the sales with the good rating ratio, we can see the data points are stratified. The reason is that we generate random points using normal distribution from each range. What’s more, for the general trend, the game quantity is decreasing as the sales increase. If the game is AAA, they are clustered at greater sale than the game that is not AAA.
There are few games that have high sales but low ratio. Many Non-AAA games have low ratio and low sales while AAA games don’t. It means even for low ratio AAA games they could have a relatively high sales because of the reputation.
Games with the largest sales are AAA games. It’s no doubt because we pick AAA games by their sales. However, we can see that except a few best sales games, there are lots of good sales Non-AAA games which are better than most of the AAA games. The game market is not ruled by AAA companies. Non-AAA companies can make use of their advantages to compete with AAA companies. Thus, the healthy competition flourishes the market.
6.3.3 Ratio and Average time

In this plot of ratio and average playtime between AAA companies and other companies. We find out that the log data have an approximate normal distribution. There is no big difference between AAA companies and others. The average playtime may be influenced by other factors, such as game type but not the ratio.
And the distributions of average playtime with different ratios are similar. Different players have different preferences. As long as the games have their unique features, there will be players spending a lot of time on them.